Evidence note: Deploy Desk implementation guide as of 2026-08-18. This is a practical observability pattern for agentic software; adjust logging, retention, and privacy controls to your legal and security requirements.
Quick answer
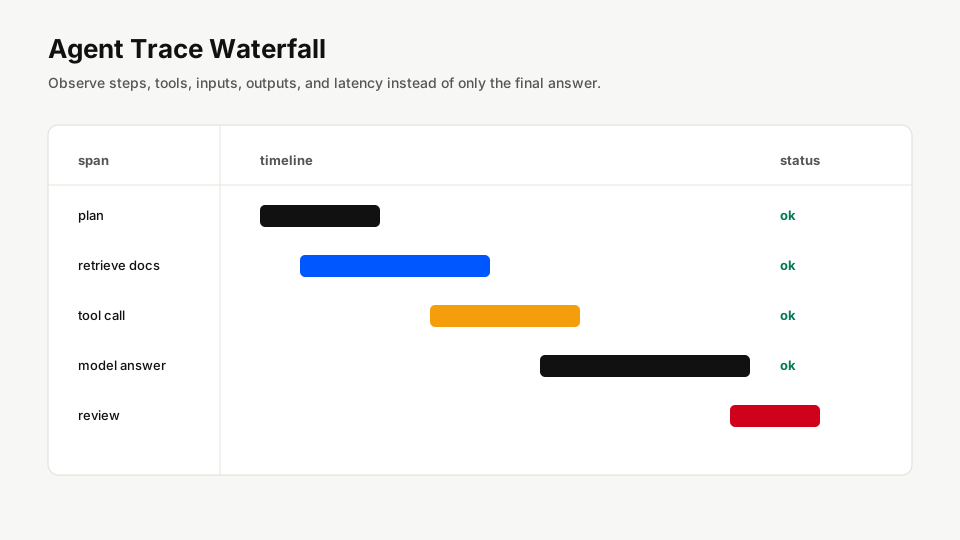
AI agent observability means tracing the agent’s plan, retrieval, tool calls, browser or API actions, model responses, policy checks, and human review outcomes. Standard app logs are not enough because the risky behavior is often inside the decision path: which tool was selected, what input was sent, what output was trusted, and whether the agent should have stopped. A production agent needs trace IDs, sanitized tool-call logs, failure labels, cost and latency metrics, and alerts for blocked writes or review-rate spikes.
Why agent observability is different
A normal web request is often deterministic: user action, server route, database query, response. An agent run is more open-ended. It may retrieve documents, call tools, browse pages, write files, send API requests, or ask a model to choose the next action. That flexibility is why agent systems are powerful. It is also why debugging them from final answers is almost useless.
If an agent sends the wrong email, changes the wrong record, or hallucinates a report summary, you need to answer practical questions:
- What task did the user ask for?
- What plan did the agent create?
- Which tool did it call?
- What exact input was sent to the tool?
- What output came back?
- Which model response converted that output into an action?
- Was a write action blocked, approved, or executed?
For more conceptual background, pair this with agent failure modes and observability.
Step 1: assign one run ID per task
Every agent task should have a stable run_id. All model calls, retrieval calls, tool calls, policy checks, and review events attach to that ID. Without it, you will end up stitching together logs manually after something breaks.
Minimum run metadata:
run_iduser_idor tenant ID, if allowed by privacy policytask_typemodeland model versionstarted_atandcompleted_atfinal_status: success, failed, blocked, user_cancelled, human_reviewcost_estimateand token usage
Step 2: log every tool call
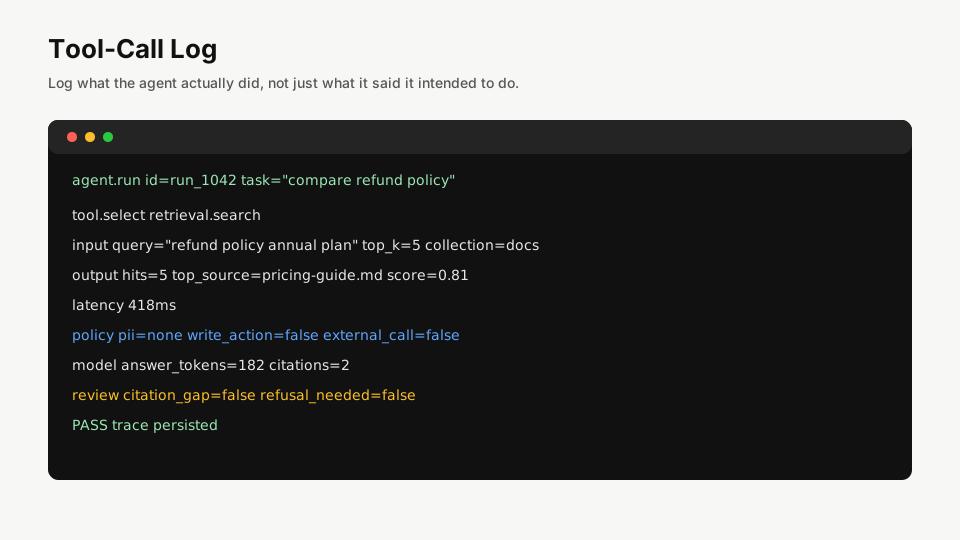
Tool calls are where agent risk becomes concrete. A model draft can be wrong, but a tool call can send data, spend money, create a ticket, modify a file, or execute a transaction. The log must make that visible.
Recommended fields:
run_idandspan_idtool_nametool_versioninput_summaryand a redacted full input when permittedoutput_summaryand a redacted full output when permittedlatency_mserror_codewrite_action: true or falsepolicy_result: allowed, blocked, needs_review
Step 3: separate model errors from tool errors
Teams often call every agent failure a hallucination. That hides the fix. Use failure labels that point to the real layer:
| Label | What happened | Likely fix |
|---|---|---|
| bad plan | Agent chose the wrong strategy | Improve task router or planning examples |
| bad retrieval | Agent used weak or irrelevant evidence | Fix RAG retrieval and citations |
| tool selection error | Agent chose the wrong tool | Clarify tool descriptions and gating |
| tool execution error | Correct tool failed or timed out | Improve retries and API handling |
| policy miss | Risky action was allowed | Add approval gates and stricter rules |
| unsupported answer | Final response made claims beyond evidence | Require citations or refusal |
If your agent relies on retrieval, use the practical RAG workflow in RAG Evaluation Playbook.
Step 4: add autonomy-risk metrics
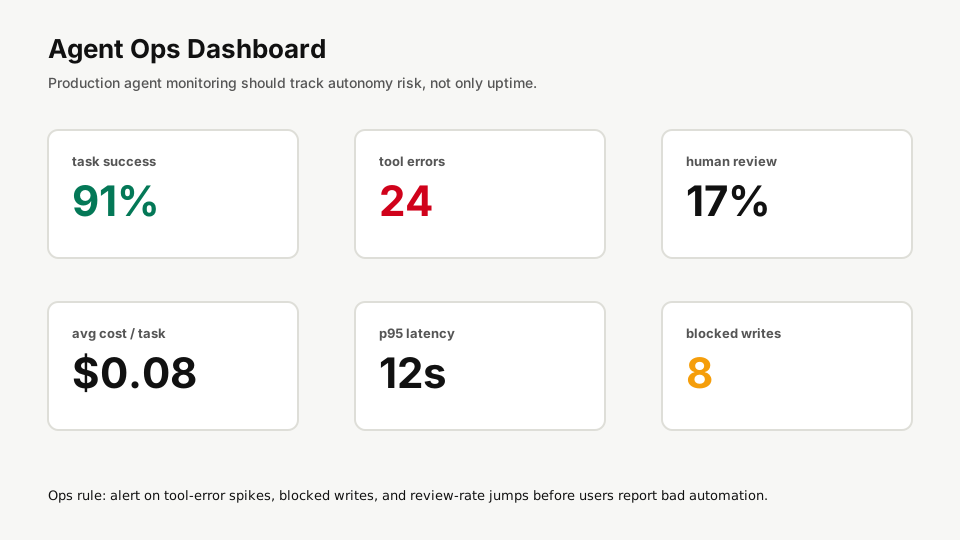
Traditional service metrics are still useful: error rate, latency, uptime, cost. Agent products need additional metrics around autonomy:
- Tool error rate by tool.
- Blocked write actions.
- Human review rate.
- Reopened or corrected tasks.
- Unsupported answer rate.
- Average cost per successful task.
- Prompt or model version associated with regressions.
Step 5: decide what requires approval
Not every step needs a human. But high-impact actions should not be hidden inside agent autonomy. A practical approval policy might require review when the agent:
- Sends external messages.
- Changes billing, account, or permission data.
- Deletes or overwrites files.
- Executes purchases, trades, or irreversible operations.
- Uses low-confidence retrieval for a high-risk answer.
- Touches regulated or private data.
The rule is simple: automate low-risk work first, then expand autonomy after traces prove the agent behaves correctly.
Production checklist
- Each task has one
run_id. - Each model and tool call has a child span.
- Tool inputs and outputs are logged with redaction.
- Write actions are explicitly marked.
- Blocked actions and human reviews are counted.
- Failures are labeled by layer.
- Prompt and model versions are stored.
- Alerts exist for tool-error spikes, blocked-write spikes, and review-rate jumps.
FAQ
Do I need OpenTelemetry for agent traces?
OpenTelemetry is a good fit if your stack already uses it. If not, start with structured JSON logs and a trace ID. The important part is linking every step of the run.
Should I store full prompts and outputs?
Only when your privacy and retention policy allows it. Many teams store redacted payloads plus summaries, hashes, and source IDs.
What is the first alert I should add?
Alert on tool-error spikes and blocked write actions. These often reveal broken integrations or risky autonomy before users complain.
Agent observability is not just debugging. It is the control surface that lets a team increase autonomy without losing accountability.