
Quick answer
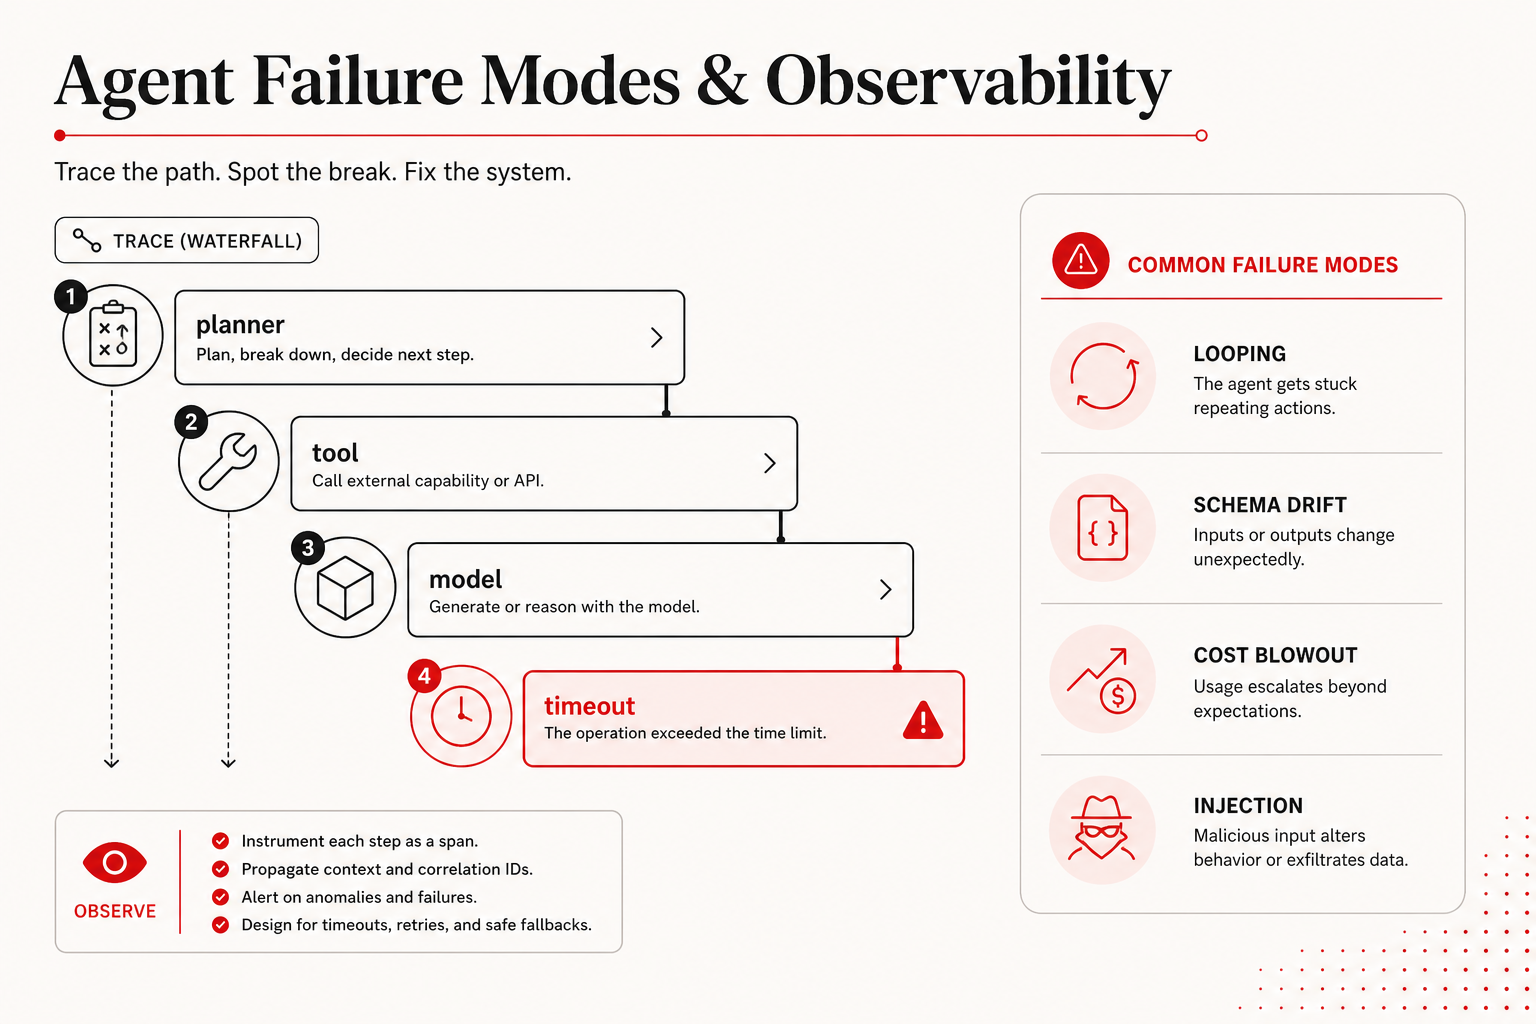
LLM agents fail differently from chatbots: infinite loops, wrong tool arguments, partial work marked success, stale retrieval, prompt injection, and runaway token spend. Agent observability needs trace spans per tool call, structured eval hooks, budget caps, model version logging, and human escalation paths, not only aggregate API latency. Treat production agents like distributed systems: assume failure, design for replay, and tie safety to least-privilege tools before expanding autonomy.
Key takeaways
- Log prompts, tool I/O, and model versions per run—with PII masking and retention policy.
- Set max steps, timeouts, and spend alarms before users hit them for you.
- Replay production failures in staging harnesses; sample successes sparingly for cost.
- Red-team untrusted content especially for browser and coding agents.
- Place observability after architecture clarity in the agent map; orchestration multiplies traces (orchestration patterns).
Why chatbot monitoring fails for agents
Chatbot dashboards track time-to-first-token, error rate, and thumbs up/down. Agents add directed graphs: conditional branches, external side effects, partial state, and retries. An agent run may “succeed” HTTP-wise while failing the business task—wrong ticket closed, email drafted but not sent, SQL read returning empty without error.
Without spans, on-call engineers grep logs for a user complaint and guess. With spans, they replay the exact tool sequence, see schema parse failures, and patch the tool or cap loops. Observability is not optional for agents at scale—it is the difference between a pilot and an incident factory.
Failure mode catalog
| Failure mode | Symptom | Likely cause | First response |
|---|---|---|---|
| Planner loop | Max steps hit, no user value | Vague stop condition | Tighten done schema, reduce tools |
| Tool schema drift | JSON parse errors spike | API/version change | Validate + alert on schema hash |
| Wrong tool choice | Plausible but incorrect action | Ambiguous tool descriptions | Rename/split tools, add examples |
| Silent empty success | User sees “done”, data unchanged | Tool swallows errors | Structured errors to model |
| Stale retrieval | Confident wrong facts | Index lag | Freshness checks, citations |
| Cost blowout | Margin collapse | Agent loops, vision steps | Per-task budgets, routing |
| Injection via tools | Policy bypass, exfiltration | Untrusted HTML/PDF/issues | Allowlist, sanitize, verify |
| Permission overreach | Data leak, unauthorized write | God-token tools | Least privilege scopes |
| Multi-agent conflict | Contradictory state | Shared memory races | Single-writer roles |
| Reasoning timeout | Partial output, user hang | Long think + no fallback | Fallback model, async job |
Looping and stop conditions
The most visible agent incident is the infinite loop: the model alternates between two tools, re-asks the same question, or never emits the structured “complete” object. Root causes include:
- Stop condition described only in natural language.
- Tools returning errors the model cannot interpret.
- Missing “give up and ask human” path.
- Verifier rejecting without actionable feedback.
Fixes are product and engineering, not “smarter model” by default: explicit max iterations, exponential backoff on repeated tool names, circuit breakers when identical arguments repeat, and escalation UI.
Tool misuse and schema failures
Tool misuse spans calling the wrong function, hallucinating argument values, and calling write tools when read-only suffices. Schema failures spike after backend deploys change field names or enums.
Production patterns:
- Pre-flight validation before execution; return typed errors.
- Idempotency keys on writes to survive retries.
- Schema versioning in tool registry with CI tests.
- Shadow mode logging proposed tools without executing during rollout.
Tool design guidance: tool use ships vs demos.
Retrieval and memory failures
Agents that retrieve poisoned or stale chunks fail confidently. Memory compaction may drop constraints. Multi-agent setups may write contradictory summaries.
Observability hooks for memory:
- Log query, top-k doc IDs, scores, and index version.
- Track citation click-through and human correction rate.
- Alert when retrieval returns empty above baseline rate.
Architecture: agent memory hybrid, RAG pillar.
Security and abuse failures
Agents enlarge attack surface: prompt injection via web pages, malicious PDFs, issue comments on repos, email bodies fetched by tools. Failures may be silent exfiltration—not visible in user-facing text.
Minimum controls (injection risks, safety pillar):
- Separate system instructions from untrusted content with delimiters and policy templates.
- Block outbound tools on unverified retrieval sources.
- Human approval on external send and financial writes.
- Red-team corpus updated when new tool types ship.
Observability stack: what to implement
| Stage | Minimum bar | Do not expand until |
|---|---|---|
| Pilot, read-only | Trace ID, model version, tool status, max steps | One failed run can be replayed end-to-end |
| Write tools with approval | Approval actor, idempotency key, rollback path | Human rejects are labeled and fed to evals |
| Multi-agent graph | Parent/child spans, role cost, handoff payloads | On-call can identify the failing role quickly |
| Enterprise rollout | SIEM export, retention tiers, kill switch, SLOs | Legal, SRE, and product share one incident runbook |
Tracing
Each user request gets a trace ID spanning model calls, tool executions, retrieval, and human approvals. OpenTelemetry-compatible spans integrate with existing APM (OpenTelemetry). LLM-native platforms (Langfuse-class, LangSmith-class, Phoenix-class) add prompt/version tagging—evaluate against your compliance needs.
Metrics
- Success rate on business-defined pass/fail—not just HTTP 200.
- Steps per success and p95 latency per step type.
- Tokens and $/successful task including hidden reasoning tokens where billed.
- Human takeover rate and time-to-human.
- Tool error rate by tool name and schema version.
- Injection block rate on red-team suite.
Logging policy
Logging full prompts may violate GDPR/DPA. Typical approach: mask PII fields, truncate retrieved HTML, hash sensitive args, retain failures longer than successes, provide export/delete hooks. Document retention in security reviews.
Sampling strategy
Sample 100% of failures for replay; 1–5% of successes for drift detection. Always log aggregates. High-volume chat may require dynamic sampling—never drop failure events.
Eval hooks in production
Offline evals are insufficient alone. Production hooks include:
- LLM-as-judge on sampled outputs—with known bias limits.
- Deterministic checks (JSON schema, SQL EXPLAIN, unit tests on generated code).
- Human review queues for low-confidence routes.
- Canary prompts after model version changes (post-train moves).
Public leaderboard scores rarely predict your agent graph (leaderboards guide).
Runbooks and incident response
Define severity when agents touch production data:
| Severity | Example | Immediate action |
|---|---|---|
| SEV1 | Unauthorized data exfil or mass wrong writes | Kill switch, revoke tokens |
| SEV2 | Elevated wrong actions on paid tier | Disable write tools, human mode |
| SEV3 | Loop storms, cost spike | Lower max steps, rate limit |
| SEV4 | Quality regression, no data impact | Rollback prompt/model version |
Runbooks should link traces to rollback actions: prompt template version pin, model ID revert, tool schema rollback. Post-incident, add replay tests so the failure becomes a permanent harness case.
Guardrails beyond logging
- Budget caps: per user, per tenant, per task type.
- Allowlists: domains, tools, SQL tables.
- Async queues for long agent jobs with progress UI.
- Dual control on high-risk operations.
- Feature flags per agent graph version.
Multi-agent observability
Multi-agent traces need parent/child spans per role with structured handoff payloads—not only message text (orchestration patterns). Metrics should attribute cost to role. Mis-routing by supervisor is a first-class alert.
Browser and coding agent specifics
Browser agents add screenshot artifacts, DOM snapshots, and navigation timelines. Store artifacts for compliance review (browser agents case).
Coding agents need CI integration logs: tests run, diff size, secret scan results, review comments (coding agents compared). Injection via issue bodies is a supply-chain class failure—monitor proposed shell commands.
Building an observability rollout plan
- Instrument single-agent baseline with trace ID and tool spans.
- Define business success metric with product—not engineering alone.
- Add max steps and spend caps.
- Ship replay harness fed by production failures.
- Add red-team suite for injection paths.
- Expand to multi-agent only when single-agent traces are clean.
- Quarterly review metrics vs margin (knowledge worker stack).
Dashboards that actually help on-call
Beyond vendor LLM observability UI, wire these panels to your incident bridge:
- Agent success rate by graph version (15-minute rollups).
- Steps histogram with alert when p95 steps double hour-over-hour.
- Tool error heatmap by tool name + schema version.
- Spend velocity dollars per hour per tenant with anomaly detection.
- Human escalation queue depth and age of oldest item.
- Injection firewall triggers from red-team pattern matches in prod.
Correlate with model version deploy markers—post-train changes masquerade as “agent regressions” (model stack).
SLIs and SLOs for agent features
| SLI | Measurement | Starter target (illustrative) |
|---|---|---|
| Task success | Business pass/fail eval | 90% on top 5 journeys |
| p95 end-to-end latency | User-visible completion | < 60s sync, async otherwise |
| Cost per success | Tokens + tools + human | Within margin model |
| Unbounded loop rate | Runs hitting max steps | < 2% of runs |
| Critical tool failure | SEV-triggering tool errors | Near zero |
Illustrative targets are not guarantees—set from baseline week one of pilot.
Chaos and game days
Quarterly agent game days inject:
- Tool latency spikes and 500 errors.
- Model provider rate limits.
- Stale retrieval index snapshot.
- Poisoned document in sandbox tenant.
- Supervisor mis-route scenarios in multi-agent graphs (orchestration).
Validate kill switches and human fallback paths under stress—not only happy-path demos.
Privacy-preserving observability
Techniques when full prompt logging is prohibited:
- Tokenized user IDs; no raw email in traces.
- Hash tool arguments; store reversible encryption only for failure samples.
- Differential retention: 7 days success metadata, 90 days failure artifacts.
- On-prem observability stack for regulated tenants.
Legal review beats engineering assumptions—document in safety pillar checklist.
From chat metrics migration
Teams promoting chatbots to agents often keep chat dashboards. Add agent-specific dimensions:
- Replace “messages per session” with “tool calls per successful task.”
- Replace thumbs up/down with structured outcome labels tied to CRM/ticket state.
- Track partial completion explicitly—agent said done but backend disagree.
Align product analytics with platform traces via shared trace ID in client SDK.
Failure replay harness anatomy
- Ingest failed trace JSON from prod (redacted).
- Re-run against staging graph with same model version pin.
- Diff tool sequence and final state hash.
- Attach replay test to CI on graph or tool schema change.
- Label root cause: tool, model, retrieval, policy, user input.
Replay converts incidents into assets—critical for browser and coding agents with high variance (browser case, coding compare).
Tool-use specific telemetry
For each tool invocation log:
tool_name, schema_version, latency_ms, status, bytes_in/out- Idempotency key for writes
- Retry count and backoff tier
- Approval gate ID if applicable
Compare with tool use production patterns—parse error spikes often precede user-visible “agent got dumb” reports.
On-call runbook snippets
Symptom: success rate drop after deploy. Check: model version marker, tool schema hash, retrieval index age. Mitigate: rollback graph version; disable write tools; enable human-only mode banner.
Symptom: cost spike hour-over-hour. Check: max steps hit rate, vision tool usage, tenant ID. Mitigate: rate limit tenant; lower max steps; alert account manager.
Symptom: suspected exfiltration. Check: outbound tool logs, DNS from sandbox. Mitigate: kill switch; revoke tokens; preserve trace for security review per injection guide.
Aligning product, legal, and SRE
Agent observability touches three constituencies. Product wants funnel metrics; legal wants retention limits; SRE wants traces. Single trace ID with role-based views beats three incompatible logging systems. Document who can view raw prompts in runbook appendix.
Evaluating observability vendors
Questions beyond feature lists:
- Export traces to your SIEM?
- Self-host option for regulated data?
- PII scrubbing hooks before ingest?
- Cost at your trace volume—sampling defaults may hide incidents.
Reference docs: Langfuse, OpenTelemetry—verify current pricing and data residency separately.
Post-incident learning loop
After SEV2+ agent incidents:
- Timeline from traces, not memory.
- Root cause tag (tool/model/retrieval/policy).
- New replay test in harness within 5 business days.
- Prompt/tool change with version bump.
- Comms to affected tenants if data touched.
Connect to safety practices and agent architecture updates if rung assumptions were wrong.
Building a failure taxonomy dataset
Label production failures into a shared taxonomy—examples:
LOOP_MAX_STEPSTOOL_SCHEMA_PARSETOOL_TIMEOUTRETRIEVAL_EMPTYRETRIEVAL_STALEINJECTION_BLOCKEDPERMISSION_DENIEDHUMAN_REJECTED
Monthly review taxonomy counts—spikes drive roadmap better than generic “quality down” tickets. Share summaries with PM and safety teams; injection spikes link to injection playbook updates.
Canary and shadow deployments for agent graphs
Ship new graph versions to 1–5% traffic with shadow mode (execute but do not commit writes) before full cutover. Compare success and cost distributions against incumbent version for seven days minimum. Roll back on regression without debate—agent regressions are user-visible quickly.
Executive reporting without vanity metrics
Leadership dashboards should show:
- Successful tasks per 1,000 active users (trend).
- Cost per successful task vs revenue line if applicable.
- Incident count by severity month-over-month.
- Human escalation rate—rising escalations may mean agent overreach, not “more human touch.”
Avoid reporting raw message volume or average latency without success context—agents inflate both while failing tasks.
Bridging to traditional APM
LLM traces should link to service traces: when tool calls hit microservices, propagate trace context so backend latency appears in same waterfall as model spans. On-call should not switch tools mid-incident. OpenTelemetry baggage fields carry tenant and graph version across hops.
Runbook: weekly agent health review
Platform on-call weekly checklist (15 minutes):
- Success rate delta vs prior week by graph version.
- Top 3 failure taxonomy codes and owners assigned.
- Cost per success delta—finance flag if >10% without traffic mix change.
- Open red-team failures not yet patched.
- Model vendor changelog skim—schedule retest if tool-calling mentioned.
Routine reviews catch drift before executives see support ticket spikes.
Customer communication during agent incidents
When agents cause user-visible errors, comms should state scope (read vs write impact), workaround (human mode), and ETA for fix—avoid blaming “the AI” without actionable detail. Preserve trust with transparency; link internal postmortem IDs to customer success if B2B.
SLO error budgets for agent features
Treat agent success rate like any feature SLO: define monthly error budget; when exhausted, disable write tools or revert graph version until root cause fixed. Error budgets prevent “keep shipping prompts” culture while incidents accumulate. Pair with finance error budget on token spend—either budget tripped should trigger review.
On-call training with trace exemplars
Maintain a library of ten redacted golden traces: five successes, five failures with annotated root cause. New on-call engineers replay exemplars in staging before paging access. Agent incidents confuse teams used to stateless APIs—training material reduces mean time to innocence for model vs tool vs retrieval bugs.
Vendor shared responsibility model
When using vendor Agent SDKs, clarify in contracts who owns trace retention, model version change notification, and sub-processor lists. Your observability stack may be hybrid: vendor UI for prompt debugging, internal SIEM for security alerts. Map responsibilities in a RACI so incidents do not stall between “platform team says ask vendor” and vice versa—especially for injection and data exfiltration events requiring fast token revocation.
Regulatory and audit exports
Regulators and enterprise auditors increasingly ask for AI decision logs. Design export bundles: trace IDs, tool summaries, human approvals, model versions—without leaking unrelated customer PII. Batch export API beats manual screenshotting during audits; legal defines scope, engineering implements redaction templates aligned with safety practices.
Integration with feature flags and experiments
Agent graph versions should map to feature flag keys—rollback means flip flag, not emergency deploy on Friday. A/B tests comparing graph variants need ethical guardrails: do not experiment on write paths affecting money or health without explicit risk review. Log experiment assignment ID in traces for post-hoc analysis when success rates diverge between cohorts.
Who this is for
- Platform and SRE teams owning agent reliability.
- On-call engineers needing replay—not grep.
- Security reviewing agent permissions and logs.
- ML ops connecting model version changes to regressions.
Who should skip
- Pre-pilot experiments with no production side effects—lightweight logging may suffice temporarily.
- Teams without defined success criteria—metrics will be meaningless.
- Organizations prohibited from logging prompts—solve policy first.
Common mistakes
| Mistake | Why it fails | Better move |
|---|---|---|
| Only API latency dashboards | Miss business failure | Pass/fail eval per task |
| No model version in logs | Unreplayable regressions | Pin ID + template version |
| Logging raw PII forever | Compliance breach | Mask + retention tiers |
| Max steps unset | Cost incidents | Hard caps + alerts |
| No kill switch | SEV1 duration | Feature flag per graph |
FAQ
Is logging prompts a privacy issue?
Yes—mask PII, align retention with DPA/consent, and offer deletion paths. Often log structured metadata more than full text.
Langfuse vs LangSmith vs custom?
Choose based on data residency, export APIs, and integration with your APM—not feature checklists alone. Reference: Langfuse docs.
What is the one metric executives should see?
Cost per successful task at p95—not average chat latency. Tie to margin.
How do we detect loops early?
Alert on repeated tool name/args within a trace, rising step count without state change, and token velocity thresholds.
Do small teams need full OTel?
Start with trace IDs and JSON logs; adopt OTel when multiple services and agents intersect.
What is the minimum observability bar for a pilot agent?
Trace ID, model version, tool name/status per step, max-step enforcement, and 100% failure capture—even before dashboards. If you cannot replay one failed run end-to-end, you are not ready to widen permissions.
Should agents and chat share one dashboard?
Share infrastructure if traces align, but separate business metrics—agents need task success and cost per success, not message volume alone.
Who owns agent on-call?
Usually platform SRE with ML on-call consult—define in runbook before launch so pager routing is not debated during SEV1 incidents. Document escalation to security when injection or exfiltration traces appear, even if root cause is not yet confirmed.
Are LLM observability tools enough alone?
No—pair with existing APM, log aggregation, and incident management. LLM-native tools excel at prompt-level debug; SIEM excels at cross-system correlation and long retention policies.
Sources
- OpenTelemetry — tracing standards for distributed systems including LLM tool chains.
- Langfuse documentation — LLM observability patterns (reference, not endorsement).
- OpenAI production best practices — API reliability and monitoring concepts applicable to agents.
What we did not test: We did not benchmark observability vendors or publish incident rate statistics. Failure taxonomy and runbooks are desk synthesis from public docs and reported patterns.
Corrections: Update tool names, vendor observability SKUs, and regulatory logging guidance when sources change—refresh as-of date at top. When major cloud providers change log retention defaults, revisit PII masking rules in the same correction pass—not only the SEO title. Add new failure taxonomy codes when product adds tool types so dashboards stay interpretable.
Agents are distributed systems that generate text. Observability transforms them from demo to operable product: traces explain incidents, taxonomies guide fixes, guardrails cap harm, and replay tests prevent repeats. Invest in spans, budgets, and human escalation before investing in another agent role. Pair with tool use production patterns and injection defenses as part of the same operating model—not bolt-on afterthoughts.
Next step
Apply observability to a bounded workflow: browser agents for research desks or coding agents in coding tools compared. Revisit architecture in agent map if failures trace to missing rungs before scaling traces, spend caps, or extra multi-agent roles.