Quick answer
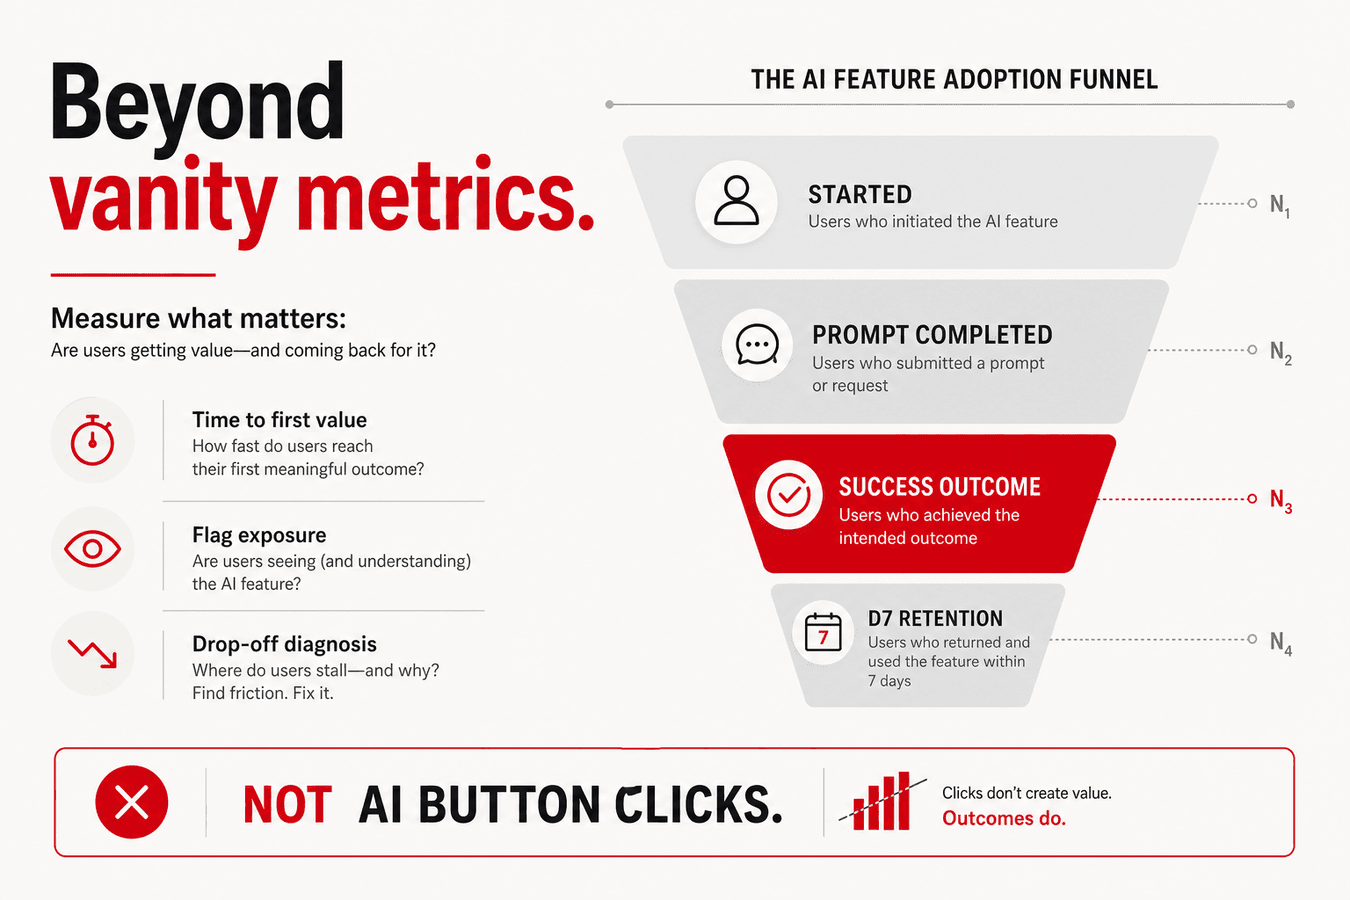
AI feature adoption is not “users clicked the AI button.” Measure the prompt → successful outcome funnel, time-to-first-value, D7/D30 retention on AI cohorts, and conversion under feature-flag exposure. Vanity metrics—sessions, raw message counts, “AI panel opens”—hide the failure modes that kill product trust: slow inference, bad defaults, silent abandon at onboarding step three, and model swaps that look fine on HTTP 200 while success events collapse. Wire PostHog-class product analytics into the same event schema you use for billing and flags, then review weekly under Guide → Monday product rhythm. Practice the north-star cards in CorpIM Studio before you invent a custom dashboard sprawl.
Key takeaways
- Define one success event per AI feature (export completed, ticket resolved, code merged)—not “model returned text.”
- Segment cohorts by plan, model version, prompt template, and flag exposure.
- Pair analytics with feedback votes so roadmap priority is evidence, not loudest demo.
- Retention dips usually map to one friction step or latency cliff—not “users don’t like AI.”
- Feature flags let you measure adoption during gradual rollout without polluting the whole tenant base.
Who this is for
- Product leads shipping copilot, agent, or generative features inside B2B SaaS.
- Growth and RevOps teams tired of reporting “AI messages per user” to the board.
- Engineers who need one event schema for analytics, billing meters, and incident correlation.
- Founders deciding whether low usage is a model problem, a UX problem, or a distribution problem.
Who should skip
- Pre-launch teams with zero users—define success events in the spec, instrument after the first design-partner cohort.
- Internal-only tools with fewer than five active users—structured interviews beat dashboards short term.
- Readers who only need rollout mechanics—start with gradual rollout for models and prompts.
- Teams hunting public leaderboard scores as a substitute for product funnels—those are model selection inputs, not adoption proof.
What “AI feature adoption” actually means
In classical SaaS, adoption often means “activated seat used the feature this week.” AI features break that definition. A user can open the copilot panel, send three prompts, receive fluent text, and still fail the job they came to do. From the product’s point of view that session looks “engaged.” From the customer’s point of view the feature wasted ten minutes.
Desk synthesis across AI SaaS product loops points to a sharper definition: adoption is repeated successful outcomes under a defined success event, measured on a cohort that was intentionally exposed to the feature. That definition forces three design choices before you write a single analytics query:
- Success is product-shaped. “Report exported,” “PR opened with AI-authored diff accepted,” “ticket closed with AI draft sent” beat “completion tokens > 0.”
- Exposure is intentional. If some tenants are on the old prompt via a flag and some are not, blend them and you invent a fake middle.
- Repetition matters. One successful trial is activation. Habit is D7/D30 return among users who already succeeded once.
This article stays on the measurement system. When production breaks mid-funnel, switch to the production RCA playbook. When you need traces and error fingerprints under the funnel, use the open-source LLM observability stack. When you want the operating cadence that reviews these numbers every Monday, use the weekly operating rhythm.
Metrics that matter (decision table)
| Metric | Decision it unlocks | Anti-pattern | Typical review cadence |
|---|---|---|---|
| Activation rate | Whether first successful AI outcome happens within 24–72h of exposure | Counting “opened AI panel” | Daily for new launches; weekly steady-state |
| Prompt completion rate | Whether UX friction blocks the model from running | Ignoring drop at file upload or auth step | Daily during onboarding experiments |
| Outcome success rate | Whether model + product quality produce the job-to-be-done | Blaming the model when submit never fires | Weekly; per flag cohort during rollout |
| Time-to-first-value (TTFV) | Whether the default path is too long for busy B2B users | Average without p50/p90 split | Weekly for new features |
| Latency p95 (user-perceived) | Whether the feature feels broken even when HTTP is green | Only watching provider status pages | Realtime alert + weekly trend |
| D7 / D30 retention (AI cohort) | Habit vs novelty spike | Blending AI and non-AI users | Monday product review |
| Flag exposure → conversion | Whether a new model/prompt earns wider rollout | 100% flip without cohort compare | Per stage of gradual rollout |
| Error rate per feature | Silent abandon before support tickets appear | Errors-only tooling without product funnel | Realtime + post-deploy window |
| Cost per successful outcome | Whether adoption is affordable | Token spend without success denominator | Weekly FinOps join with meters |
Treat the table as a ladder. If activation is broken, do not debate D30. If completion is broken, do not swap models. If success is broken with clean completion, then prompt/model/eval work earns priority. If success is high and D7 is low, you have a habit-loop problem, not an intelligence problem.
Vanity metrics to demote
Vanity metrics are not “wrong numbers.” They are numbers that create false confidence and wrong roadmaps. Demote them from board slides and weekly Guide top-3 unless they are clearly labeled as leading indicators only.
- Total prompts without a success definition. High prompt volume can mean users retrying a broken path.
- AI messages per user without error rate and success rate. Chatty failure looks like engagement.
- Demo and internal account traffic mixed into production funnels. Staff tenants pollute activation.
- Pricing-page traffic as a proxy for AI product value. Marketing can spike visits while the feature fails in-app.
- Public model benchmark scores as adoption evidence. MMLU-class numbers do not tell you if onboarding step three drops users.
- “AI attach rate” defined as any AI click. Attach without outcome is a UI curiosity metric.
Keep vanity metrics in a secondary dashboard if finance or investors ask for volume. Never let them drive the decision table above.
Define success events before you instrument
Most weak AI analytics programs fail at naming, not tooling. Product and engineering must agree on the success event in the same ticket that defines the feature. Write it as a sentence a support agent could verify:
- “User exports a PDF that includes at least one AI-generated section and downloads it.”
- “User creates a support reply draft from AI and sends it from the ticket UI.”
- “User accepts an AI code suggestion that lands in a merged PR within seven days.”
Then encode that sentence as an event with stable properties:
ai_feature_started
  feature_key, tenant_id, user_id, plan, surface, flag_variant

ai_feature_prompt_submitted
  feature_key, model_id, prompt_version, input_bytes_bucket, has_attachment

ai_feature_succeeded
  feature_key, outcome_type, latency_ms, model_id, prompt_version, flag_variant

ai_feature_failed
  feature_key, error_code, stage, model_id, prompt_version, flag_variant
Bucket sizes and redaction matter. Do not ship raw prompts into analytics by default. Prefer hashed prompt templates, size buckets, and error codes. If you need content for evaluation, route a sampled subset to an eval store with a retention policy—not into the product analytics warehouse forever.
Align billing units with the same success language when possible. If Lago meters “report_generated” and PostHog celebrates “ai_feature_succeeded” with a different definition, finance and product will fight every Monday. See billing for AI API usage for meter design that can share the same event spine.
Funnel design: from exposure to habit
Build one primary funnel per AI feature, then clone it per important segment. A practical default for B2B copilots:
- Exposed — user or tenant receives the feature (flag on, entitlement on, UI visible).
- Started — intentional entry (opened composer, clicked “Generate,” launched agent).
- Prompt completed — request left the client and reached your API/worker.
- Model returned — non-empty response without hard failure (useful debug step; not success).
- Succeeded — verifiable product outcome.
- Returned D7 — another success (or defined engagement) within seven days of first success.
Why insert “model returned” if it is not success? Because it separates transport/model availability from product acceptance. Teams that jump from “started” to “succeeded” cannot tell whether users hated the output or never received it.
Segment every step by at least:
- Plan / entitlement tier
- Acquisition path or onboarding path
model_idandprompt_version- Flag variant / rollout stage
- Client surface (web, API, mobile, in-editor)
If you only segment by plan, you will miss that Enterprise tenants on prompt v12 succeed while Growth tenants on prompt v9 stall at attachment upload. That is a product bug with a model-shaped excuse.
Instrumentation implementation steps
- Freeze the event contract in a short RFC. Name fields once. Changing
feature_keymid-quarter destroys cohort history. - Instrument client and server. Client events catch UX abandon. Server events catch worker failures after the UI already showed optimism.
- Attach deploy and flag context. Every success/fail event should know which flag variant and release tag produced it.
- Build the funnel in PostHog-class analytics from signup or exposure → first success. Save a named insight; do not rebuild it live in meetings.
- Alert on funnel cliffs. Example: >10% relative drop in prompt completion for 2 hours on a paying cohort. CorpIM-style demo alerts such as
PH-RET-091exist to force ownership, not to invent magic thresholds. - Join feedback. Link top Fider/Canny-class votes to Plane/Linear epics with ICE scores so “users hate AI” becomes a ranked backlog item with a funnel step attached.
- Join cost. Weekly join of successful outcomes vs metered spend. High usage without retention is a margin and product smell together.
- Review in Guide weekly top-3 when retention drops. The operating system is the review, not the chart.
Do not wait for a perfect warehouse. A scrappy event stream with honest success definitions beats a lakehouse of vanity events.
Cohorts that tell the truth
Cohort design is where AI analytics becomes decision-grade. Prefer these cohort cuts:
- First-success cohort — users who succeeded once in week W; measure return in W+1.
- Flag-exposed cohort — tenants on new model/prompt vs control at the same calendar window.
- Plan-gated cohort — paid vs trial; trial-heavy AI usage with no card is often a cost leak, not a growth engine.
- Surface cohort — in-product UI vs public API. API “adoption” without UI habit can still be healthy for developer products; name it honestly.
- Incident-exposed cohort — tenants who hit a latency or error incident; check D7 after the outage window. Silent GlitchTip-green latency spikes still kill habit—pair with RCA follow-up.
Avoid “all users who ever clicked AI” as your retention denominator. Novelty seekers inflate the base and make every feature look like it is dying.
When adoption is low — diagnose before swapping models
| Signal | Likely cause | Next action | Wrong move |
|---|---|---|---|
| High start, low prompt completion | UX friction, permissions, upload, unclear empty state | Session replay; fix steps 2–3; shorten required inputs | Larger model |
| High completion, low “model returned” | Timeouts, rate limits, worker backlog | Check queue depth and provider errors; see observability guide | Rewrite marketing copy |
| High model return, low success | Prompt/product quality, wrong default task framing | Eval set on real tasks; prompt iteration behind a flag | 100% cutover to “better” bench model |
| High success, low D7 | No habit loop; feature not in weekly workflow | Templates, notifications, embed in existing jobs-to-be-done | Add more chat chrome |
| Success OK, cost per success exploding | Wrong unit economics or over-long context | Cap context; cache; route cheap model for easy tasks | Ignore until invoice shock |
| Errors spike only on new flag % | Bad rollout of model/prompt/code | Pause flag; rollback pin; run RCA | Keep expanding “to gather more data” |
| Funnel flat, feedback screams “wrong answers” | Eval gap vs production distribution | Sample failures into eval; version prompts | Blame “users don’t get AI” |
Run a retention dip response playbook every time D7 moves against you on a meaningful cohort: isolate the cohort → gather tickets and feedback → write one hypothesis tied to a funnel step → ship one experiment → watch the next 7-day cohort. Do not jump to “bigger model” without funnel evidence. Bigger models raise cost and latency; they do not fix a missing file-picker.
Pair product analytics with flags and rollout
Adoption measurement without flag context is how teams gaslight themselves. If you ship a new prompt to 25% of paid tenants, your global success rate may barely move while the exposed cohort collapses. Always compute:
- Success rate on exposed vs control
- p95 latency on exposed vs control
- Support-tag rate on exposed vs control
- Cost per success on exposed vs control
Advance the flag only when the exposed cohort wins or ties on the decision metrics you declared before the experiment. That discipline is the measurement half of gradual rollout for models and prompts. The ops half—error budgets, security gates, Wednesday release review—lives there; do not duplicate the full ladder here.
Join adoption to cost and margin
AI features can look “adopted” while destroying contribution margin. Track cost per successful outcome and successful outcomes per paying seat weekly. Patterns to act on:
- High success, rising cost per success → context bloat, tool-call loops, or wrong model routing.
- High usage, low success → users retrying; you may be metering failures as billable—align with billing policy.
- Trial tenants with high token burn and near-zero activation → tighten trial caps; do not celebrate “AI engagement.”
Product analytics answers “are they succeeding?” Billing meters answer “can we afford that success?” You need both. Details on meters and hybrid quotas live in how to bill for AI API usage.
Common mistakes (failure table)
| Mistake | Why it hurts | Fix |
|---|---|---|
| Success = any model text | Hides useless outputs | Define verifiable product outcomes |
| One global dashboard for all AI features | Averages hide the broken feature | Per-feature funnels and owners |
| No flag variant on events | Cannot attribute regressions | Require flag + prompt_version properties |
| Staff tenants in production cohorts | Fake activation and retention | Exclude internal accounts by default |
| Weekly review of vanity only | Roadmap tracks noise | Guide top-3 = activation, success, D7 |
| Analytics schema ≠ billing schema | Finance vs product fights | Shared event spine and unit dictionary |
| Ignoring latency as adoption | Users churn silently | p95 on the same cohort chart as success |
| Treating leaderboards as product proof | Wrong optimization target | Eval on your task distribution |
| No link from feedback → epic → metric | Complaints never close the loop | ICE-scored backlog with funnel step tags |
| Instrument after the launch party | You cannot learn from the first cohort | Events ship with the feature flag, not after |
Weekly operating rhythm for adoption metrics
Measurement without a calendar becomes archaeology. Fit AI adoption into the Monday product block of your weekly operating rhythm:
- Read activation and D7 for each active AI feature (exposed cohorts only).
- Pick at most three anomalies worth human time.
- Attach each anomaly to a funnel step and an owner.
- Decide: fix UX, change prompt behind a flag, pause rollout, or escalate to incident/RCA.
- Write the decision in the same place the team already works (IM todo / Guide)—not in a slide graveyard.
Wednesday release review should refuse to expand a model flag if Monday showed the exposed cohort losing on success or D7. That is how product analytics becomes an operating constraint instead of a wallpaper.
What observability adds (without replacing product analytics)
Product funnels tell you where users drop. Observability tells you why the machine failed when the drop is technical. Wire error fingerprints, queue depth, and trace IDs so a funnel cliff can jump to a concrete incident narrative. The stack map and logging discipline live in open-source observability for LLM apps. Do not dump full prompts into logs “for analytics”—keep planes separate: product outcomes in analytics, redacted operational signals in APM, sampled eval content in an eval store.
When the funnel collapse is sudden and correlated with deploy or flag percentage, stop optimizing copy and run cross-system RCA.
Board and investor reporting without lying
Executives will ask for a single “AI adoption” number. Give them a small packet, not a mashup:
- Activation — % of exposed paying seats with ≥1 success in the last 7 days.
- Habit — D7 return among first-success users.
- Quality proxy — success rate and p95 latency for the default surface.
- Economics — cost per success vs plan allowance.
Explicitly label what you are not claiming. Do not present message volume as product-market fit. Do not present a one-week novelty spike as durable adoption. If a flag experiment is in flight, say so—global averages during a 25% rollout are not strategy.
Minimal viable analytics stack
You do not need a twenty-tool platform on day one. A workable Startup OS-shaped stack looks like:
- Product analytics (PostHog-class) for funnels and cohorts
- Feature flags (Unleash/PostHog flags) for exposure control
- Error tracking (GlitchTip-class) for failure rates per feature
- Metering (Lago-class) for cost per success
- Feedback (Fider-class) linked to issue tracker
- IM + Guide for weekly decisions and alerts
That composition is the product half of an AI-native Startup OS: loops that share IDs instead of screenshot archaeology across five SaaS tabs.
Worked example (desk synthesis narrative)
A fictional B2B SaaS ships “AI summary” on tickets. Week one: messages per user look great. Activation defined as “opened summary panel” is 62%. Support still hears “AI is useless.”
They redefine success as “summary sent as customer reply or saved as internal note.” Activation collapses to 18%. Funnel shows huge drop between panel open and prompt submit: the UI required three mandatory fields users did not have. After removing two fields and adding a template, prompt completion doubles. Success rises. D7 stays weak because summaries were not in the agent’s daily queue view—so they embed a “summarize queue” action on the home screen. D7 moves. Only then do they A/B a new model behind a flag. The model helps a bit; the funnel work did most of the job.
That sequence is the point of this guide. Model swaps are last-mile optimization after the product definition of success is honest.
CorpIM CTA
In CorpIM Studio, open the Product loop: north-star cards, roadmap, feedback votes, retention todos, and flag-aware adoption charts in one operating surface. Use it to rehearse Monday reviews before your metrics meeting becomes five browser tabs.
Open CorpIM Studio → https://www.romewayai.com/corp-im/
FAQ
What counts as a successful outcome for AI feature adoption?
A verifiable product event: file exported, PR opened, ticket reply sent, report saved—not “model returned text.” Define it jointly with product and engineering in the feature RFC, then encode it as ai_feature_succeeded with stable properties.
Should we track token usage in PostHog?
Optional for cost debugging, but billable units should mirror your Lago meters. Avoid two definitions of “usage.” Prefer cost per successful outcome over raw tokens in product reviews.
How often should AI cohorts be reviewed?
Weekly on Monday for retention and activation; automated alerts for sharp funnel drops (for example >10% relative). Align the human review with your weekly operating rhythm.
Do public leaderboards replace product analytics?
No. Leaderboard scores help with model shortlisting. They do not tell you whether onboarding step three converts. Use evals on your task distribution plus funnels for adoption.
What if we have almost no users yet?
Write the success event and event schema now, instrument when the first design partners land, and rely on interviews until sample size supports cohort math. Do not invent precision from five noisy accounts.
Continue the semantic path
Next: put measurement behind safe exposure with gradual rollout for models and prompts. When funnels collapse after a ship, use production RCA. For the wider operating system, read AI-native Startup OS.
Gradual rollout · Bill AI API usage · Weekly operating rhythm · LLM observability · Production RCA · Startup OS