Quick answer
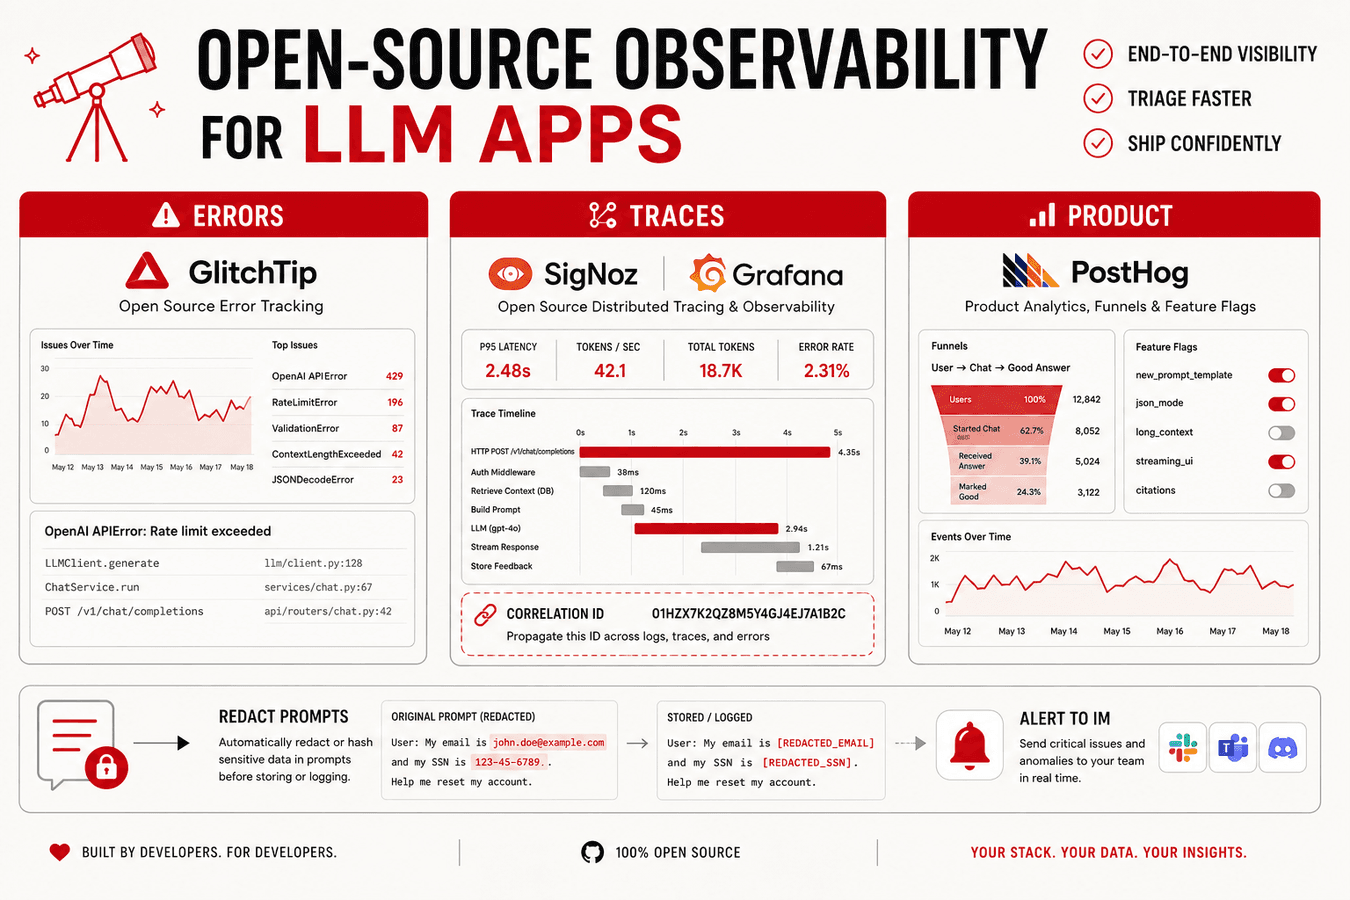
Open-source observability for LLM apps is a three-plane system: errors (GlitchTip/Sentry-compatible), metrics and traces (SigNoz or Grafana-class stacks), and product outcomes (PostHog funnels and flags). Model vendor dashboards alone miss queue backlog, OAuth failures, and silent quality drops customers feel first. Log correlation IDs and token/latency metadata; redact prompts by default; alert into IM with runbooks. For agent-specific traces, deepen with AI agent observability. CorpIM Engineering demos errors + traces + security CI as one narrative—open CorpIM.
Key takeaways
- Treat model timeouts and tool exceptions as application errors with deploy tags—not only vendor status-page folklore.
- Worker queue depth often predicts async AI job failures before users file tickets.
- Correlate release IDs with error fingerprints and flag exposure before you blame “the model.”
- Product funnels catch silent failures (empty answers, abandoned copilots) that never become 500s.
- Open stacks reduce data-residency friction for many EU buyers—but ops load is real; run TCO honestly.
Who this is for
- Engineering teams running async LLM workers, tool-using agents, or RAG pipelines in production.
- Startup CTOs comparing self-host observability versus Datadog/New Relic-class lock-in on cost or residency.
- Teams preparing enterprise reviews that ask for trace retention, access control, and incident evidence.
- Product + eng pairs who need adoption funnels beside latency—not two disconnected weekly meetings.
- Ops leads wiring alerts into an AI-native Startup OS so incidents become owned todos.
Who should skip
- Batch offline eval jobs with no production SLA—object-storage logs and notebooks may suffice.
- Teams already on managed APM with LLM plugins, acceptable margin, and residency fit—migrate only when forced.
- Readers who only need incident narrative templates—start with production RCA.
- Founders hunting a single “best LLM observability” crown—this is a reference map, not a leaderboard.
- Pre-product prototypes without users—add structured logging first; full three-plane ops can wait days, not months after first paid traffic.
What “LLM observability” must cover
Classic APM watched web requests and databases. LLM products add inference calls, embedding jobs, retrieval, tool execution, and sometimes GPU workers. Failures span layers:
- Hard failures — 500s, crashes, uncaught tool exceptions.
- Soft failures — timeouts, empty completions, retrieval misses, policy refusals that look like “success” HTTP 200.
- Systemic failures — queue backup, worker thrash, provider outages, cost spikes from runaway retries.
- Product failures — users stop after first AI attempt; retention dies while error rates look fine.
A stack that only stores prompt/response pairs will miss OAuth bugs. A stack that only watches CPU will miss empty answers. Three planes are the desk minimum for AI SaaS.
Stack map (reference, not ranking)
| Layer | Open tool class | LLM-specific signals | Primary question answered |
|---|---|---|---|
| Errors | GlitchTip (Sentry-protocol) | 500s, context overflow exceptions, tool failures | What broke, how often, after which deploy? |
| Metrics / traces | SigNoz / Grafana+Tempo/Prometheus-class | p95 latency, queue depth, worker health, token counters | Where time and backlog hide? |
| Logs | Loki-class (optional) | request_id, tenant_id, prompt_version (redact content) | Can we reconstruct a single bad request? |
| Product | PostHog | Success funnel, flag exposure, retention by cohort | Did users get value after the call succeeded? |
| Uptime | Upptime-class | Public API / health endpoint SLO | What do customers see externally? |
| Security CI | Trivy, Semgrep-class | CVEs on inference/agent images | Did we ship a known vuln with the worker? |
Compare hosting economics with self-host vs API TCO. For deep agent graphs, add the specialized patterns in agent traces, tool calls, and failure logs.
Public docs anchors for orientation (not endorsements): SigNoz documentation, PostHog documentation, and Sentry-protocol compatible self-host options such as GlitchTip’s public project docs.
Decision table: self-host vs managed vs hybrid
| Constraint | Prefer | Avoid |
|---|---|---|
| EU residency / long retention non-negotiable | Self-host traces/logs or EU-region managed with DPA | Default US SaaS with unclear retention |
| <3 eng, no ops capacity | Managed errors + metrics; self-host later | Full SigNoz+Loki+Upptime on day one |
| High cardholder or health-adjacent content | Strict redaction + short retention + access reviews | Full prompt storage “for debugging forever” |
| Complex multi-tool agents | Trace spans per tool + product funnel | Only storing final assistant text |
| Enterprise questionnaire soon | Document retention, access, and incident evidence paths | Undocumented personal Grafana on a laptop |
Residency and retention choices also feed SOC 2 privacy and availability evidence. Observability without a retention policy becomes a compliance liability.
What to log (and what not to)
| Log / field | Why | Do not log (default) |
|---|---|---|
| request_id, tenant_id, model_id, prompt_version, flag variant | Correlate errors, rollouts, and funnels | Full customer prompts unless policy + retention allow |
| token counts, latency ms, cache hit, retrieval doc count | Cost and SLA debugging | Raw PII from retrieved chunks |
| tool name, status, error class | Agent RCA | Raw API keys, secrets, auth headers in error payloads |
| queue depth, worker id, retry count | Async failure prediction | Entire conversation transcripts in shared error projects |
| deploy git_sha / release_id | Regression attribution | “Latest” without immutable version tags |
When you must store content samples for quality review, isolate them: separate store, shorter TTL, stricter ACL, and explicit legal basis. Do not casually enable “log all prompts” on the shared error tracker.
Metrics that matter for LLM SaaS
Start small. Desk synthesis favors a short golden set:
- Request success rate — define success as “usable completion,” not merely HTTP 200.
- p95 end-to-end latency — gateway → retrieval → model → tools → response.
- Model / provider error rate — timeouts, 429s, 5xx from vendors.
- Queue depth and age — for async jobs.
- Token usage per tenant — cost and abuse detection; join to billing later.
- Flag exposure × error rate — for gradual rollouts.
Avoid inventing industry “good” latency numbers here. Set SLOs from your product promises and customer contracts. Label them as your targets, not universal benchmarks.
Alerting starter rules
- Error rate > 2× your recent baseline for 10 minutes → incident channel with fingerprint link.
- p95 API above your published or internal SLO → draft status note; page owner.
- Queue depth or oldest job age critical → scale/runbook in Outline-class docs.
- Flag cohort shows error spike → pause gradual rollout.
- Failed payment webhooks → RevOps todo, not engineering-only noise.
- Security scan HIGH on inference image → block promote or record exception with owner.
Alerts without runbooks train people to mute them. Every page should answer: who owns it, what to check first, when to tell customers.
Three-plane incident story (how the map works)
Example pattern when login or OAuth 500s spike while AI features look “fine”:
- Errors — GlitchTip-class fingerprint groups the route; deploy tag shows the bad release.
- Traces — SigNoz-class spans show DB timeout versus LLM timeout versus IdP latency.
- Product — PostHog shows login or activation funnel drop on the same cohort and time window.
Without three planes, eng fixes the wrong layer while product debates “AI quality.” With three planes, Copilot-style ops questions can cite IDs instead of vibes—see boundaries in AI copilot vs chatbot for startups.
When the failure is inside the agent graph (tool loops, partial failures), escalate instrumentation using agent observability.
RAG and async workers — extra signals
RAG: log retrieval hit counts, empty-retrieval rate, and downstream “answered with citations” rate. Empty retrieval plus a fluent model answer is a product bug, not a model win.
Async workers: track enqueue rate, processing rate, dead-letter count, and age of oldest job. Customers experience backlog as “AI is down” even when the API process is healthy.
Streaming: watch time-to-first-token and cancel rates. High cancels with healthy server metrics often mean UX or latency pain, not crashes.
Rollouts, flags, and observability
Every model or prompt change should carry prompt_version / model_id / flag variant into errors, traces, and product events. That is how you prove a canary is safe—or roll back with evidence. Process detail: gradual rollout for models and prompts.
Pair with adoption metrics so you do not declare victory on latency while prompt-to-success collapses.
From incident to compliance evidence
Postmortems are not only culture—they are availability and change-management evidence when SOC is in scope. Store them where GRC can point to them. Link severity, timeline, root cause, and corrective actions. Practical control mapping: SOC 2 checklist for AI SaaS. RCA craft: AI feature production root cause.
Retention policies for traces and error payloads should be written before auditors ask. “We keep everything forever for ML” is a privacy finding, not a flex.
Minimal event and span schema (desk pattern)
You do not need a perfect enterprise taxonomy on day one. You need fields every service can emit so humans and copilots can join stories:
request_id/trace_id— join across gateway, worker, and model client.tenant_id— never debug “a user” without tenancy.release_idorgit_sha— regression attribution.model_id,prompt_version,flag_key/ variant — rollout truth.tool_name,tool_status,error_class— agent RCA without dumping secrets.token_in,token_out,latency_ms— cost and SLO debugging.deeplink— URL back to the human-verifiable record.
If a connector cannot provide a deeplink, treat its signal as weak evidence. Ops copilots that cannot be clicked through will not earn founder trust—same rule as in Startup OS event design.
Sampling, cardinality, and cost control
Open-source does not mean free. High-cardinality labels (raw prompt text, unbounded user IDs on every metric) will melt storage and query time. Desk patterns:
- Keep raw content out of metrics; use bounded enums for error class and tool name.
- Sample successful traces more aggressively than errors; keep errors dense.
- Separate hot (7–14 day) and cold (object storage) retention when volume grows.
- Budget a monthly observability cost line next to inference COGS—both are variable with usage.
Run the hosting decision through self-host vs API TCO. Teams often self-host traces for residency while keeping error SaaS for speed; hybrid is normal, not impurity.
Customer-visible reliability vs internal dashboards
Internal p95 can look fine while customers feel pain on a regional path or a single enterprise tenant. Add:
- Public health or status checks for customer-facing API routes (Upptime-class).
- Per-tenant or per-plan error burn when concentration risk is real.
- Support-tag correlation: “AI broken” tickets should deep-link to fingerprints.
Status communication is part of availability evidence when SOC Availability is in scope. A quiet internal Grafana during a customer outage is still an outage.
Security scans as an observability sibling
Inference workers and agent runners are containers like any other. CVE noise is real, but shipping an unscanned GPU image into prod is how enterprise questionnaires turn ugly. Wire Trivy/Semgrep-class results into the same Engineering loop as errors: findings get owners, release gates, or documented exceptions. That bridge is why CorpIM-style demos show security CI beside GlitchTip and SigNoz—not because scanners are “APM,” but because incidents and vulns share release narrative.
For control mapping, see SOC 2 checklist for AI SaaS.
Worked example: empty answers that never page
Symptom: enterprise pilot says “the assistant is useless.” Error rate is flat. Model vendor status is green.
- Product plane: PostHog shows attempt→success collapse after a prompt flag flipped to 25%.
- Trace plane: retrieval span shows empty hits rising; model span still “succeeds” with fluent filler.
- Error plane: no exception—because the app returned HTTP 200.
Fix path: define success events, alert on empty-retrieval rate, pause the flag per gradual rollout, write a short postmortem for RCA discipline. Without the product plane, eng would have stared at healthy 500 charts forever.
On-call and runbook stubs (minimum viable)
Every alert you keep should point to a runbook stub with four lines:
- What the alert means in customer language.
- First three checks (dashboard links with release filter).
- Mitigations ranked (rollback flag, scale workers, failover provider).
- When to update status page / customers / IR risk section.
Store runbooks where the team already works (Outline-class docs or IM bookmarks). Orphan Confluence pages are how mute culture starts.
How this fits the weekly operating rhythm
Observability that nobody schedules becomes archaeology. Map planes to cadence:
- Daily: error fingerprints + queue depth.
- Wednesday: release monitors and flag exposure checks.
- Monday: funnel join for AI features.
- Monthly: incident themes into investor risk if material.
Calendar detail: AI startup weekly operating rhythm. Instrumentation without rhythm is a museum of charts.
Comparing open stacks to commercial APM (without fake scores)
Commercial APM suites often win on polished UX, vendor support, and turnkey LLM plugins. Open stacks often win on residency control, predictable infra cost at scale, and avoiding double rent on already-expensive inference margins. Desk synthesis decision questions:
- Do enterprise buyers require data residency you cannot get on your current plan?
- Is observability spend becoming a material percentage of COGS beside model APIs?
- Does your team have capacity to operate Postgres/ClickHouse-class backends?
- Do you need agent-graph views that your current tool cannot express—even with OpenTelemetry?
Answer with constraints, not brand loyalty. Migrate one plane at a time (usually errors first, then traces) so you always have a working incident path. For agent-depth gaps, read AI agent observability before ripping out a working APM.
OpenTelemetry as the portable layer
Whether you self-host SigNoz-class software or buy a managed backend, instrument with portable traces and metrics where practical. Vendor-specific SDKs that only emit proprietary events create tomorrow’s migration tax. Practical rules:
- Propagate context from HTTP gateway into async workers.
- Create child spans for retrieval, model call, and each tool.
- Record attributes from the minimal schema above—avoid dumping payloads into attributes.
- Keep a single service naming scheme so dashboards remain readable as microservices grow.
Portability is not ideology; it is how seed teams survive Series A architecture churn.
Evaluating “LLM observability” vendors without inventing benches
When a vendor demo shows pretty prompt chains, ask operational questions instead of requesting fake scorecards:
- Can we export traces in OpenTelemetry-compatible form?
- Where is content stored, for how long, and who can access it?
- How do spans join to our deploy IDs and feature flags?
- What happens to cost at 10× traffic—pricing model in writing?
- Can alerts page into our IM with deeplinks?
If answers are vague, keep the three-plane open stack and add specialized tooling later only where agent graphs demand it. Do not rip out GlitchTip-class errors because a demo looked prettier. Prefer written DPAs and retention answers over slideware claims.
Privacy redaction patterns that still allow debugging
Teams swing between “log nothing useful” and “log everything.” Middle path:
- Hash or tokenize user identifiers in shared tools when policy requires.
- Store content samples in a restricted bucket with TTL and access reviews.
- Allow break-glass access during P0 with logged elevation.
- Strip auth headers and cookies in error scrapers by default.
- Teach support tools not to paste full prompts into public tickets.
Write the policy in language sales can reuse on questionnaires. Ambiguity between eng and sales is how diligence weeks go sideways—pair with SOC 2 AI SaaS checklist. Review the policy whenever you add a new logging sink (support AI, session replay, or eval warehouses).
Common mistakes table
| Mistake | Why it fails | Fix |
|---|---|---|
| Only vendor model logs | Miss app/queue/auth failures | Three-plane stack |
| HTTP 200 = success | Empty or refused answers look healthy | Define product-level success events |
| Full prompts in shared error tracker | Privacy and SOC risk | Metadata default; isolated sample store |
| No deploy tags on errors | Cannot attribute regressions | Release ID on every service |
| Alerts without runbooks | Mute culture | IM card + owner + first checks |
| Self-host everything day one | Ops load kills product velocity | TCO by layer |
| Ignore product funnel | Silent abandonment | Join errors to adoption steps |
90-day instrumentation sequence
- Days 1–14: Errors with release tags; redaction defaults; basic uptime check.
- Days 15–30: Golden metrics (latency, error rate, queue depth); IM alerts with owners.
- Days 31–60: Traces across gateway → retrieval → model → tools; flag variants on events.
- Days 61–90: Product funnel join; retention policy written; postmortem → GRC path if selling upmarket.
Skip buying a fourth dashboard before the first three planes answer a real incident. After the first real incident, write down which field was missing from the schema and add only that field—resist boiling the ocean.
CorpIM demo path
- Studio → Engineering — Inspect sample error, observability, and security findings as one incident narrative.
- Messages — Open the errors & security channel; confirm alerts become owned todos.
- Startup Copilot — Ask for root cause with cited fingerprints—reject answers without IDs.
Live demo: https://www.romewayai.com/corp-im/. Soft next step: pick one recent AI incident and list which plane was missing; wire that plane next before adding any new vendor.
Worked example: tracing a tool-loop timeout
Illustrative incident: p95 chat latency jumps from ~2s to ~18s for a subset of tenants. Error plane is mostly green—requests eventually return. Product funnel shows ai_task_started flat and ai_task_success down. Without traces, the team debates “model slow vs network.”
With OpenTelemetry-style spans across gateway → planner → tool calls → model, you see the planner issuing five serial search_* tool calls, each waiting the full client timeout after a dependency blip. The model span is short; the tool spans dominate. Fix is concurrency caps and circuit-breaking the tool, not a model swap. Alerting should page on tool-timeout rate and planner step count—not only on HTTP 5xx.
Capture in the postmortem: correlation id, max tool depth, timeout budget, and which flag cohort was exposed. That package feeds both RCA and any enterprise evidence path. Soft-rehearse the Engineering narrative in CorpIM so the next timeout does not start in three disconnected UIs. Deeper agent-graph patterns live in AI agent observability.
What we did not test
This article is desk synthesis. We did not publish latency benchmarks, cost-per-span comparisons, or vendor rankings. Tool classes are illustrative of public documentation ecosystems. Your SLO numbers must come from your product promises—not from this page. When vendors quote “industry average MTTR,” treat it as marketing unless they publish methodology and date.
FAQ
Do we need a separate product just for open-source observability for LLM apps?
Often no. Errors + traces + product funnels cover most SaaS LLM failures. Dedicated LLM trace tools help when prompt-chain debugging at scale outgrows generic spans—add when SigNoz-class traces are insufficient for agent graphs.
GlitchTip vs Sentry?
GlitchTip speaks the Sentry protocol with a self-host option. Choose based on residency, cost, and whether you need Sentry’s commercial integrations—not based on invented superiority scores.
How does observability tie to adoption metrics?
Latency and silent empty answers kill D7 retention before crash dashboards light up. Watch funnel steps and errors together on the same release.
Self-host SigNoz or use a managed Grafana stack?
Self-host when residency or long retention forces it and you have ops capacity. Managed when margin and headcount say so—run numbers through TCO.
Where do agent tool calls fit?
As spans and structured events with status codes. Deep patterns and failure logs: AI agent observability.
Continue the semantic path
Next: turn signals into postmortems with production RCA, ship changes safely via gradual rollout, prove value with adoption metrics, and keep evidence audit-ready with SOC 2 for AI SaaS.